
November '25: The Long-Debt Illusion
With November underway, the housing market feels a bit like the rest of the economy right now: steady on the surface, uneasy underneath. Rates have come off their highs, buyers are trickling back in, and sellers are still getting deals done — but the energy is different than it was a year ago. The headlines are all about the proposed 50-year mortgage, a policy idea that sounds bold until you run the math. Meanwhile, here in Denver, the real story is quieter: pendings are softening, supply keeps building, and the market is settling into a slower, more negotiated rhythm. It’s not dramatic, but it’s meaningful — and it’s shaping how both buyers and sellers need to navigate the months ahead.
The 50-Year Mortgage
The pitch sounds simple enough: stretch the mortgage out to 50 years, lower the payment, fix affordability. President Trump and FHFA director Bill Pulte have both leaned into that idea lately, framing it as the next evolution after the New Deal–era 30-year mortgage. On paper, it looks like relief for buyers. In practice, it’s mostly a transfer of risk and cost from the system onto individual households.
A longer mortgage does exactly one thing well: it makes the monthly payment look prettier. Take a median-style U.S. home around $415,000. On a 30-year loan, one analysis pegs the payment around $2,288; stretch that to 50 years and you’re closer to $2,022 — roughly $260 less per month. Another example on a $348,000 mortgage at 6% shows a drop from about $2,086 on a 30-year to roughly $1,832 on a 50-year — again, around $250/month in “savings.”
But the tradeoff is brutal: the $348k borrower goes from paying about $403,000 in total interest on a 30-year to roughly $751,000 on a 50-year — an extra $348,000 in interest for the privilege of a slightly lower payment. Another scenario at 6.25% shows total interest almost doubling from roughly $438,000 to about $816,000 when you move from 30 to 50 years on the same principal. That’s not affordability; that’s an extremely expensive layaway plan.
The equity side is just as concerning. On a 50-year schedule, principal paydown in the early years is glacial. You’re renting your own house from the bank for longer. If you need to sell in year 5, 7, or 10 — because of a job move, a health issue, or a divorce — you’ll have much less equity to work with than you would on a 30-year. That means less down payment for the next home and a thinner buffer if you’re forced to sell into a soft or declining market.
Layer on demographics and it looks even stranger: with the average first-time buyer now around 40 years old, a 50-year mortgage implies payments stretching into their 80s or 90s unless there’s an aggressive prepayment plan. For many households, that’s not a wealth-building strategy; it’s an intergenerational liability.
And none of this touches the underlying problem: homes are expensive because they’re expensive to produce and transact, not because the amortization schedule is too short. On the hard-cost side, builders are already squeezed by elevated material costs, tight labor, and land constraints. They’re responding by rolling out smaller floor plans just to hit price points where buyers can still qualify, because they can’t profitably build at the same price-per-foot as older resale inventory.
On the soft-cost side, traditional brokerage and lending models layer in marketing overhead, bloated tech stacks, and administrative complexity that ultimately show up in the consumer’s rate and fee structure. You can stretch a mortgage to 50 years and still be paying for your lender’s ad budget.
Blue Pebble’s view is that if the real goal is a better monthly payment, you don’t need to keep people in debt for an extra 20 years to get there. You need to strip out the inefficiencies that silently tax every transaction. By re-engineering the way brokerage and lending are structured — cutting unnecessary marketing and operational waste — we deliver lower payments on a standard 30-year fixed that are competitive with what a 50-year loan would advertise, without forcing clients to pay an extra $300,000–$400,000 in lifetime interest or carry a mortgage into their retirement years.
In other words: if you like the idea of that lower payment, you can have it the smart way — by working with a broker (cough, cough… Blue Pebble) who isn’t charging you for overhead you never asked for — rather than signing up for half a century of debt.
---
Demand: Plugging Along
Supply: Elevated
Let’s take a look at our trusty market table summarizing local market conditions in the Denver metro area:
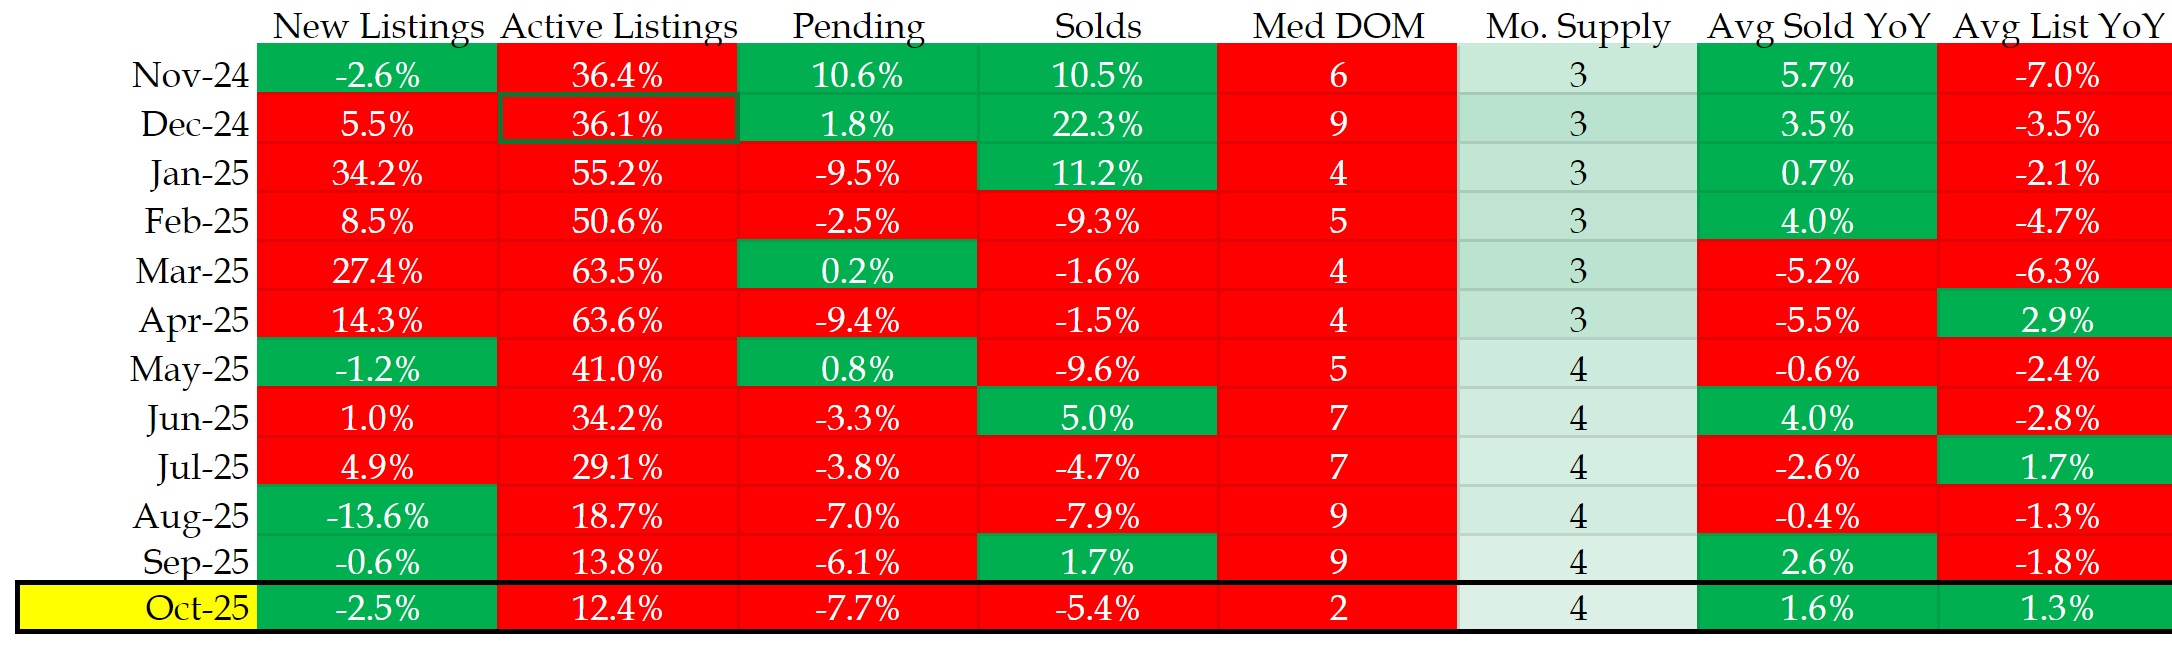
Denver Metro Real Estate Market Data - REColorado, October 2025.
Denver’s fall market is still functioning, but the momentum is softer than a year ago. Pending activity continues to slip while active supply keeps climbing, and that combination is slowly reshaping the balance between buyers and sellers.
In the detached market, pending units fell from 1,327 in September 2024 to 1,246 in September 2025 — a drop of roughly 6% — and only marginally above September 2023’s 1,208. Meanwhile, active listings have moved in the opposite direction for three straight years: 3,289 in Sept ’23 → 4,828 in Sept ’24 → 5,492 in Sept ’25. That’s a 13.8% increase year over year, and nearly 67% above 2023 levels. Days on market are telling the same story, stretching from 11 days in 2023 to 21 days in 2024 to 30 days in 2025.
Put simply, more homes are sitting longer, and fewer buyers are writing contracts than last year — all textbook signs of a gradually cooling market.
What’s interesting is that none of this weakness is coming through in headline prices. The average sold price for detached homes in September 2025 came in at $669,580, a modest increase from $652,719 a year earlier. October looked even stronger on paper, posting an average sold price of $720,474, up slightly from $708,894 in October 2024.
But these numbers need context: sellers are increasingly getting to those prices only by offering concessions, reducing list prices, or accepting more negotiated outcomes. The spread between list price and sold price has quietly widened, and even though the average price is stable, the path to the closing table is now slower, more negotiated, and more incentive-heavy than it was a year ago.
One major driver behind that negotiation pressure is the dynamic between resale and new construction. Builders still hold an edge on financing — especially 30-year buydowns that resale sellers simply can’t match — and that incentive structure continues to pull a meaningful share of demand toward new homes.
But builders are now solving affordability in a different way than they did in 2023. Instead of cutting prices, they’re increasingly shrinking floorplans. Across several submarkets, new construction is being delivered at higher dollars per square foot but smaller total square footage, allowing builders to maintain margins without blowing past consumer price ceilings.
As a result, the like-for-like comparison between a resale home and an equivalent new build is diverging. Two years ago, buyers could often get a new home that was cheaper per foot, better finished, and better financed. Today, they may still get the better rate incentive, but the home itself is often more expensive on a per-foot basis — which gives resale properties more breathing room than they had during the initial rate spike.
Overall, the Denver market doesn’t show signs of distress — just a slow, steady recalibration. Supply is up, pendings are down, and homes are taking longer to sell, but pricing remains orderly and supported. Buyers have more negotiating power than they’ve had in years, and sellers who price correctly can still achieve strong outcomes.
The biggest shift is the one happening below the surface: the resale market is no longer competing against deeply discounted, aggressively financed, full-size new construction. It’s competing against a structurally more expensive product supported by financing incentives. That subtle shift is giving the resale side more stability than the topline numbers alone would suggest.